HAProxy: Balanceador de carga
- Clonamos el repositorio con el escenario.
git clone https://github.com/josedom24/vagrant_ansible_haproxy.git
- Una vez hagamos el
vagrant up entramos en cada una de las máquinas para ver las direcciones ip que les ha dado vagrant, entonces entramos en ansible/hosts y añadimos estas direcciones.
[servidor_ha]
frontend ansible_ssh_host=192.168.121.30 ansible_ssh_user=vagrant ansible_ssh_private_key_file=../.vagrant/machines/frontend/libvirt/private_key ansible_python_interpreter=/usr/bin/python3

[servidores_web]
backend1 ansible_ssh_host=192.168.121.250 ansible_ssh_user=vagrant ansible_ssh_private_key_file=../.vagrant/machines/backend1/libvirt/private_key ansible_python_interpreter=/usr/bin/python3
backend2 ansible_ssh_host=192.168.121.14 ansible_ssh_user=vagrant ansible_ssh_private_key_file=../.vagrant/machines/backend2/libvirt/private_key ansible_python_interpreter=/usr/bin/python3
- Pasamos la receta de ansible por el escenario.
alejandrogv@AlejandroGV:~/vagrant/servicios/vagrant_ansible_haproxy/ansible$ ansible-playbook site.yaml

PLAY [all] **********************************************************************************************

TASK [Gathering Facts] **********************************************************************************
ok: [backend1]
ok: [backend2]
ok: [frontend]

TASK [commons : Ensure system is updated] ***************************************************************
changed: [backend2]
changed: [backend1]
changed: [frontend]

PLAY [servidor_ha] **************************************************************************************

TASK [Gathering Facts] **********************************************************************************
ok: [frontend]

TASK [haproxy : install haproxy] ************************************************************************
changed: [frontend]

PLAY [servidores_web] ***********************************************************************************

TASK [Gathering Facts] **********************************************************************************
ok: [backend1]
ok: [backend2]

TASK [nginx : install nginx, php-fpm] *******************************************************************
changed: [backend1]
changed: [backend2]

TASK [nginx : Copy info.php] ****************************************************************************
changed: [backend2]
changed: [backend1]

TASK [nginx : Copy virtualhost default] *****************************************************************
changed: [backend2]
changed: [backend1]

RUNNING HANDLER [nginx : restart nginx] *****************************************************************
changed: [backend1]
changed: [backend2]

PLAY [servidores_web] ***********************************************************************************

TASK [Gathering Facts] **********************************************************************************
ok: [backend1]
ok: [backend2]

TASK [mariadb : ensure mariadb is installed] ************************************************************
changed: [backend2]
changed: [backend1]

TASK [mariadb : ensure mariadb binds to internal interface] *********************************************
changed: [backend2]
changed: [backend1]

RUNNING HANDLER [mariadb : restart mariadb] *************************************************************
changed: [backend2]
changed: [backend1]

PLAY [servidores_web] ***********************************************************************************

TASK [Gathering Facts] **********************************************************************************
ok: [backend2]
ok: [backend1]

TASK [wordpress : install unzip] ************************************************************************
changed: [backend2]
changed: [backend1]

TASK [wordpress : download wordpress] *******************************************************************
changed: [backend2]
changed: [backend1]

TASK [wordpress : unzip wordpress] **********************************************************************
changed: [backend2]
changed: [backend1]

TASK [wordpress : Copy wordpress.sql] *******************************************************************
changed: [backend2]
changed: [backend1]

TASK [wordpress : create database wordpress] ************************************************************
changed: [backend2]
changed: [backend1]

TASK [wordpress : create user mysql wordpress] **********************************************************
changed: [backend1] => (item=localhost)
changed: [backend2] => (item=localhost)

TASK [wordpress : copy wp-config.php] *******************************************************************
changed: [backend2]
changed: [backend1]

RUNNING HANDLER [wordpress : restart nginx] *************************************************************
changed: [backend2]
changed: [backend1]

PLAY RECAP **********************************************************************************************
backend1                   : ok=20   changed=16   unreachable=0    failed=0    skipped=0    rescued=0    ignored=0
backend2                   : ok=20   changed=16   unreachable=0    failed=0    skipped=0    rescued=0    ignored=0
frontend                   : ok=4    changed=2    unreachable=0    failed=0    skipped=0    rescued=0    ignored=0
- Una vez terminado el escenario vamos a configurar la resolución estática, para ello primero debemos configurar el servicio de
haproxy en la máquina de frontend, así que añadimos el siguiente contenido en el fichero /etc/haproxy/haproxy.cfg
frontend servidores_web
	bind *:80
	mode http
	stats enable
	stats uri /ha_stats
	stats auth  cda:cda
	default_backend servidores_web_backend

backend servidores_web_backend
	mode http
	balance roundrobin
	server backend1 10.0.0.10:80 check
	server backend2 10.0.0.11:80 check
- Añadimos la dirección del frontend a nuestro fichero hosts de la maquina anfitriona.
192.168.121.30 www.example.org
- Comprobamos que funciona correctamente.

- Vamos a calcular el rendimiento con el balanceo de carga a dos nodos. Para ello haz varias pruebas y quedate con la media de peticiones/segundo. el primer paso para esto es instalar apache-utils.
vagrant@frontend:~$ sudo apt install apache2-utils
- Vamos a calcular el rendimiento tal como se nos indica.
alejandrogv@AlejandroGV:~$ ab -t 10 -c 100 -k http://www.example.org/wordpress/
This is ApacheBench, Version 2.3 <$Revision: 1879490 $>
Copyright 1996 Adam Twiss, Zeus Technology Ltd, http://www.zeustech.net/
Licensed to The Apache Software Foundation, http://www.apache.org/

Benchmarking www.example.org (be patient)
Finished 799 requests


Server Software:        nginx/1.18.0
Server Hostname:        www.example.org
Server Port:            80

Document Path:          /wordpress/
Document Length:        27248 bytes

Concurrency Level:      100
Time taken for tests:   10.004 seconds
Complete requests:      799
Failed requests:        0
Keep-Alive requests:    0
Total transferred:      22002713 bytes
HTML transferred:       21819857 bytes
Requests per second:    79.87 [#/sec] (mean)
Time per request:       1252.029 [ms] (mean)
Time per request:       12.520 [ms] (mean, across all concurrent requests)
Transfer rate:          2147.90 [Kbytes/sec] received

Connection Times (ms)
              min  mean[+/-sd] median   max
Connect:        0    0   0.5      0       2
Processing:    43 1174 263.7   1183    1511
Waiting:       16 1141 259.2   1151    1465
Total:         43 1175 263.2   1183    1512

Percentage of the requests served within a certain time (ms)
  50%   1183
  66%   1210
  75%   1344
  80%   1387
  90%   1438
  95%   1460
  98%   1474
  99%   1483
 100%   1512 (longest request)
- Vamos a volver a hacer y comprobar que baja el numero de respuestas (Lo he vuelto a hacer varias veces y no baja significativamente).
Requests per second: 75.60 [#/sec] (mean)
- Ahora vamos a apagar uno de los nodos usando
hatop, paquete que debemos instalar.
hatop -s /run/haproxy/admin.sock
- Usando este comando nos aparecerá esta pantalla, si nos situamos encima de uno de los nodos y pulsamos
F10 se desactivará.
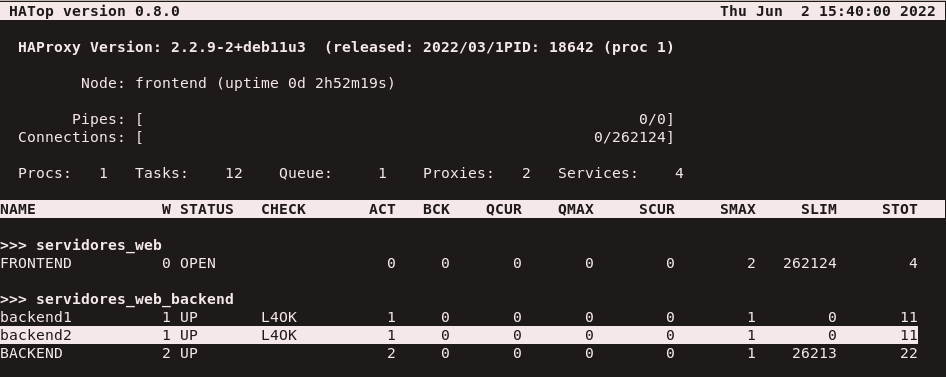
- Comprobamos el numero de respuestas, el cual podemos comprobar que ha bajado significativamente.
Requests per second: 53.18 [#/sec] (mean)
- Hemos vuelto a activar el nodo pulsado
F9, Ahora instalaremos un nuevo nodo al que pasaremos la receta de ansible y lo configuramos en el haproxy.
server backend3 192.168.121.220:80 check
- Reiniciamos el servicio y comprobamos el balanceo nuevamente.
Requests per second: 101.75 [#/sec] (mean)
Memcached
- Tenemos un nuevo escenario al que como el anterior hemos pasado una receta de ansible y también tiene instalado un wordpress. En este escenario solo tenemos una maquina y el primer paso en ella será instalar el paquete
memcached.
vagrant@servidorweb:~$ sudo apt install php-memcached memcached
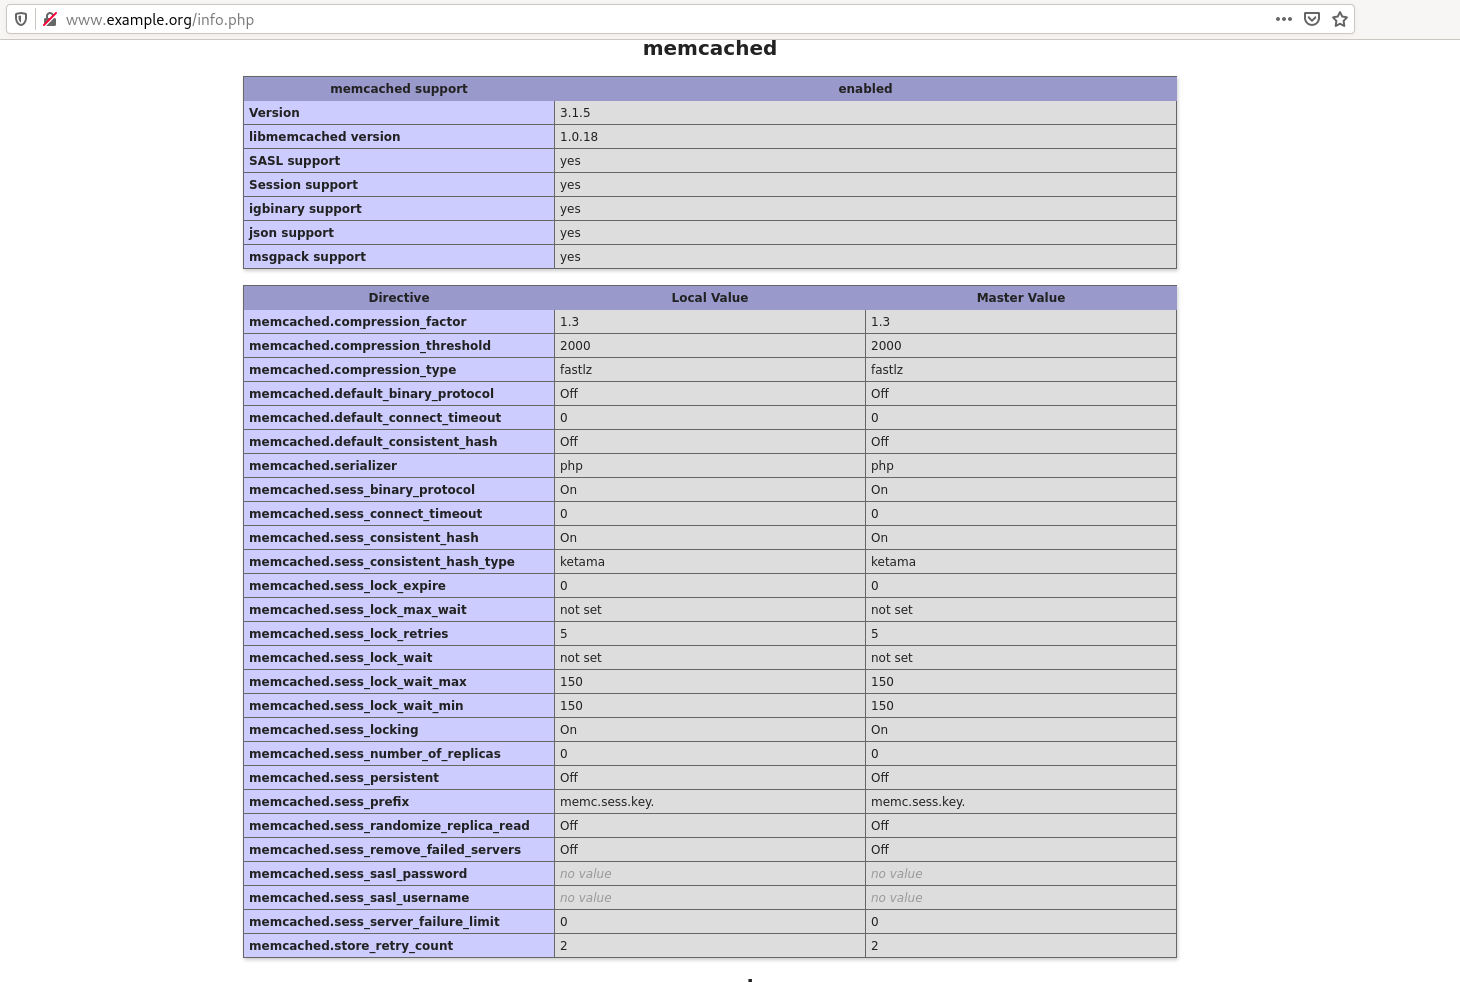
- Añadimos a nuestro
etc/hosts la nueva dirección y accedemos a la página, concretamente el info.php y si bajamos comprobaremos que tenemos instalado este paquete.
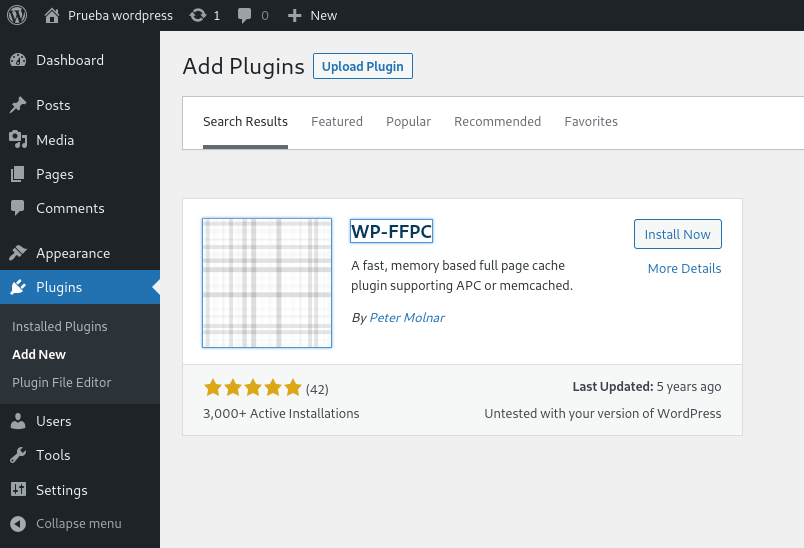
- Vamos a instalar en wordpress un plugin que nos permite trabajar con memecached. para ello nos dirigimos a la zona de administración, entramos en plugins e instalamos
WP-FFPC.
- Después de instalarlo nos aparecerá un botón de activar que pulsaremos y seguidamente tendremos una serie de mensajes de error que iremos solucionando.
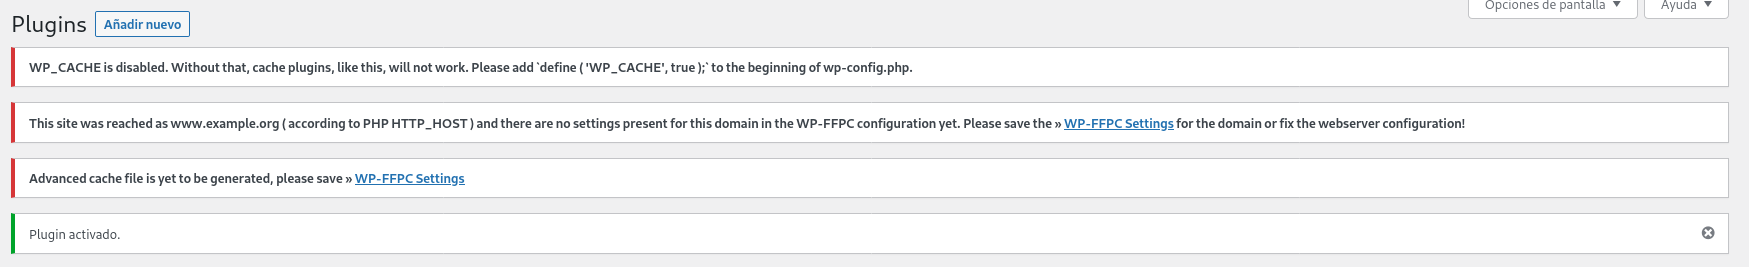
- En primer lugar nos dirigimos al fichero
/var/www/html/wordpress/wp-config.php y añadimos la siguiente línea:
define('WP_CACHE', true);
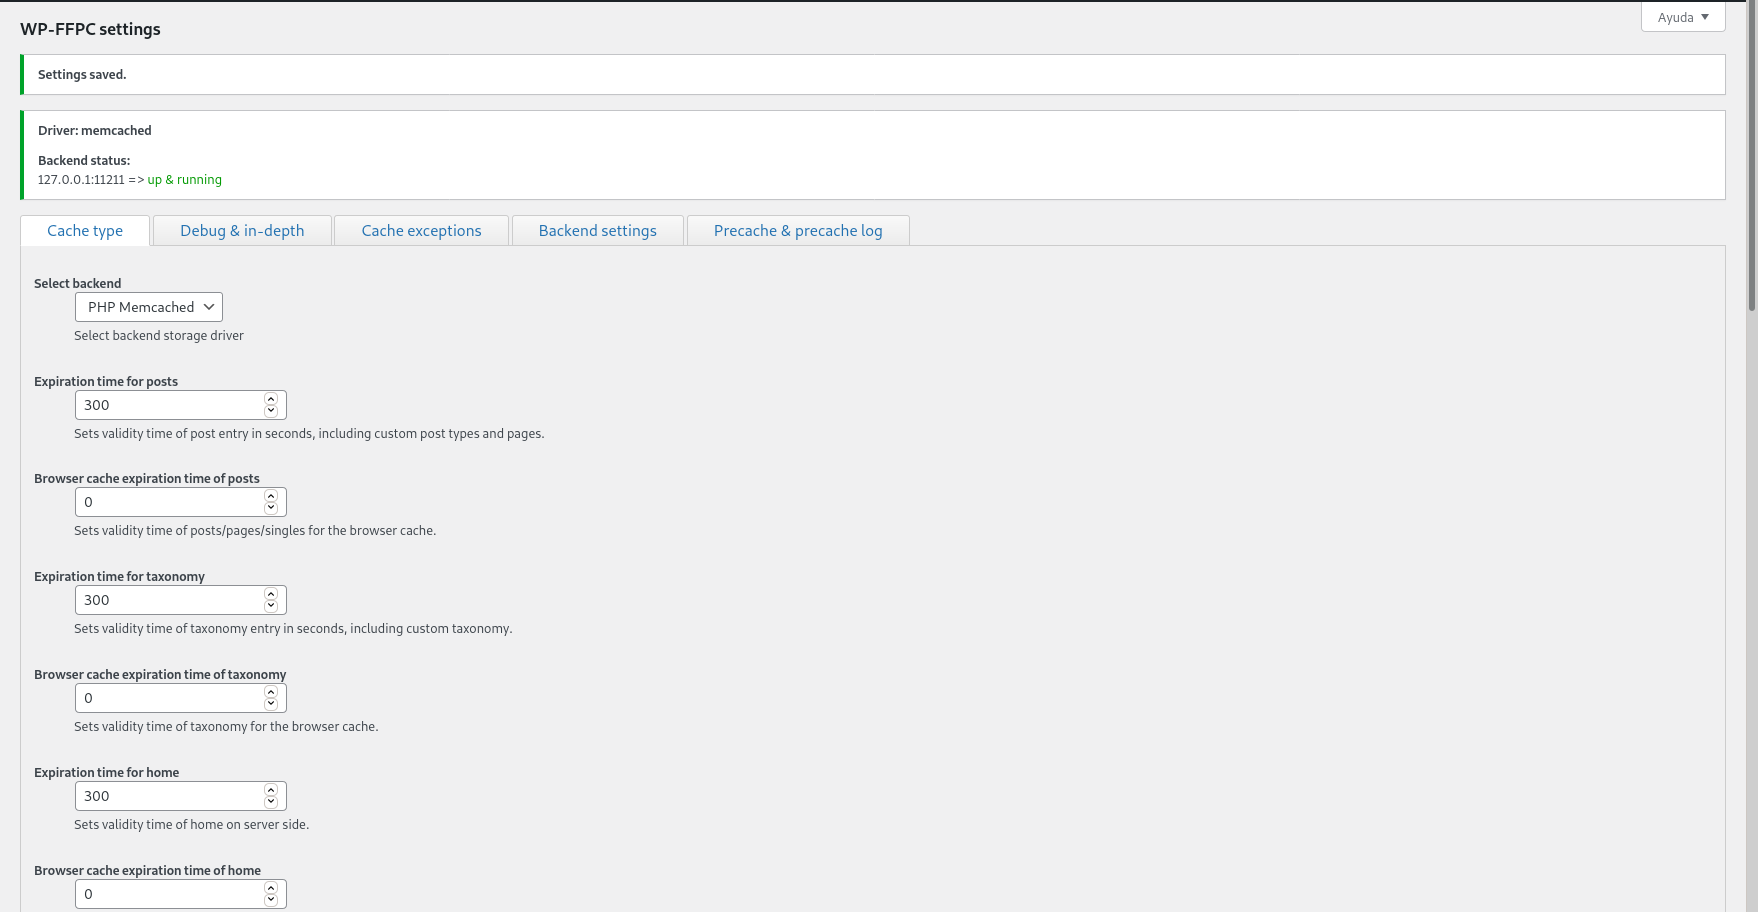
- Y nos vamos a los settings del plugin, donde podremos cambiar algunos parametros, aunque no cambiemos ninguno guardamos los cambios y así se configurará.
- Ahora vamos a hacer pruebas de rendimiento y comprobar si ha aumentado.
alejandrogv@AlejandroGV:~$ ab -t 10 -c 100 -k http://www.example.org/wordpress/
This is ApacheBench, Version 2.3 <$Revision: 1879490 $>
Copyright 1996 Adam Twiss, Zeus Technology Ltd, http://www.zeustech.net/
Licensed to The Apache Software Foundation, http://www.apache.org/

Benchmarking www.example.org (be patient)
Completed 5000 requests
Completed 10000 requests
Finished 10740 requests


Server Software:        nginx/1.18.0
Server Hostname:        www.example.org
Server Port:            80

Document Path:          /wordpress/
Document Length:        27215 bytes

Concurrency Level:      100
Time taken for tests:   10.001 seconds
Complete requests:      10740
Failed requests:        0
Keep-Alive requests:    0
Total transferred:      294673386 bytes
HTML transferred:       292289100 bytes
Requests per second:    1073.93 [#/sec] (mean)
Time per request:       93.116 [ms] (mean)
Time per request:       0.931 [ms] (mean, across all concurrent requests)
Transfer rate:          28774.89 [Kbytes/sec] received

Connection Times (ms)
              min  mean[+/-sd] median   max
Connect:        0    0   0.3      0       6
Processing:     4   89   7.1     88     369
Waiting:        3   89   7.1     88     361
Total:          9   89   6.9     88     369

Percentage of the requests served within a certain time (ms)
  50%     88
  66%     89
  75%     90
  80%     90
  90%     96
  95%    102
  98%    105
  99%    106
 100%    369 (longest request)
- Vemos que con la primera prueba ya ha mejorado bastante el rendimiento, llegando a las 1073 respuestas. Lo hemos hecho varias veces más y vemos que el rendimiento sube un poco.
Requests per second: 1127.43 [#/sec] (mean)
Varnish
- Usaremos este mismo escenario y configuraremos varnish, por supuesto primero debemos instalarlo.
vagrant@servidorweb:~$ sudo apt install varnish
- Este servicio escuchará por el puerto 80, así que debemos configurar nginx para que escuche por otro puerto en el fichero
/etc/nginx/sites-available/default.
server {
        listen 8080 default_server;
        listen [::]:8080 default_server;
- Configuramos varnish para que use este puerto en el fichero
/etc/default/varnish
DAEMON_OPTS="-a :80 \
             -T localhost:6082 \
             -f /etc/varnish/default.vcl \
             -S /etc/varnish/secret \
             -s malloc,256m"
- Y redirigirlas al 8080 donde escucha nginx, esto lo haremos el fichero
/etc/varnish/default.vcl.
backend default {
    .host = "127.0.0.1";
    .port = "8080";
}
- También debemos configurar la unidad de systemd
/lib/systemd/system/varnish.service.
ExecStart=/usr/sbin/varnishd \
          -j unix,user=vcache \
          -F \
          -a :80 \
          -T localhost:6082 \
          -f /etc/varnish/default.vcl \
          -S /etc/varnish/secret \
          -s malloc,256m
- Después de reiniciar el demonio vamos a comprobar que varnish a cogido la configuración.
● varnish.service - Varnish Cache, a high-performance HTTP accelerator
     Loaded: loaded (/lib/systemd/system/varnish.service; enabled; vendor preset: enabled)
     Active: active (running) since Fri 2022-06-03 12:17:56 UTC; 53s ago
       Docs: https://www.varnish-cache.org/docs/
             man:varnishd
   Main PID: 26157 (varnishd)
      Tasks: 217 (limit: 528)
     Memory: 112.3M
        CPU: 251ms
     CGroup: /system.slice/varnish.service
             ├─26157 /usr/sbin/varnishd -j unix,user=vcache -F -a :80 -T localhost:6082 -f /etc/varnish/default.vcl -S /etc/varnish/secret -s malloc,256m
             └─26169 /usr/sbin/varnishd -j unix,user=vcache -F -a :80 -T localhost:6082 -f /etc/varnish/default.vcl -S /etc/varnish/secret -s malloc,256m
- Una vez instalado y configurado vamos a realizar las pruebas de rendimiento.
alejandrogv@AlejandroGV:~$ ab -t 10 -c 100 -k http://www.example.org/wordpress/
This is ApacheBench, Version 2.3 <$Revision: 1879490 $>
Copyright 1996 Adam Twiss, Zeus Technology Ltd, http://www.zeustech.net/
Licensed to The Apache Software Foundation, http://www.apache.org/

Benchmarking www.example.org (be patient)
Completed 5000 requests
Completed 10000 requests
Completed 15000 requests
Completed 20000 requests
Completed 25000 requests
Completed 30000 requests
Finished 34518 requests


Server Software:        nginx/1.18.0
Server Hostname:        www.example.org
Server Port:            80

Document Path:          /wordpress/
Document Length:        7860 bytes

Concurrency Level:      100
Time taken for tests:   10.000 seconds
Complete requests:      34518
Failed requests:        34517
   (Connect: 0, Receive: 0, Length: 34517, Exceptions: 0)
Non-2xx responses:      1
Keep-Alive requests:    34517
Total transferred:      951896908 bytes
HTML transferred:       939372069 bytes
Requests per second:    3451.77 [#/sec] (mean)
Time per request:       28.971 [ms] (mean)
Time per request:       0.290 [ms] (mean, across all concurrent requests)
Transfer rate:          92957.99 [Kbytes/sec] received

Connection Times (ms)
              min  mean[+/-sd] median   max
Connect:        0    0   0.2      0       5
Processing:     0   19  19.8     17    3545
Waiting:        0   19  19.8     17    3540
Total:          0   19  19.8     17    3545

Percentage of the requests served within a certain time (ms)
  50%     17
  66%     19
  75%     20
  80%     21
  90%     23
  95%     27
  98%     33
  99%     38
 100%   3545 (longest request)
- Vemos que en la primera ya ha subido considerablemente a 3451, vamos a hacer algunas más y a comprobar la última que hagamos:
Requests per second: 5978.24 [#/sec] (mean)
- Vamos a comprobar el
acces.log para ver cuantas peticiones han llegado al servidor.
127.0.0.1 - - [03/Jun/2022:12:22:21 +0000] "GET /wordpress/ HTTP/1.1" 200 6701 "-" "ApacheBench/2.3"
127.0.0.1 - - [03/Jun/2022:12:27:46 +0000] "GET /wordpress/ HTTP/1.1" 200 6701 "-" "ApacheBench/2.3"
- Solo hay dos registros con 5 minutos de diferencia, esto debido a la duración de la cache.